About the Average Daily Spending Trends Spreadsheet
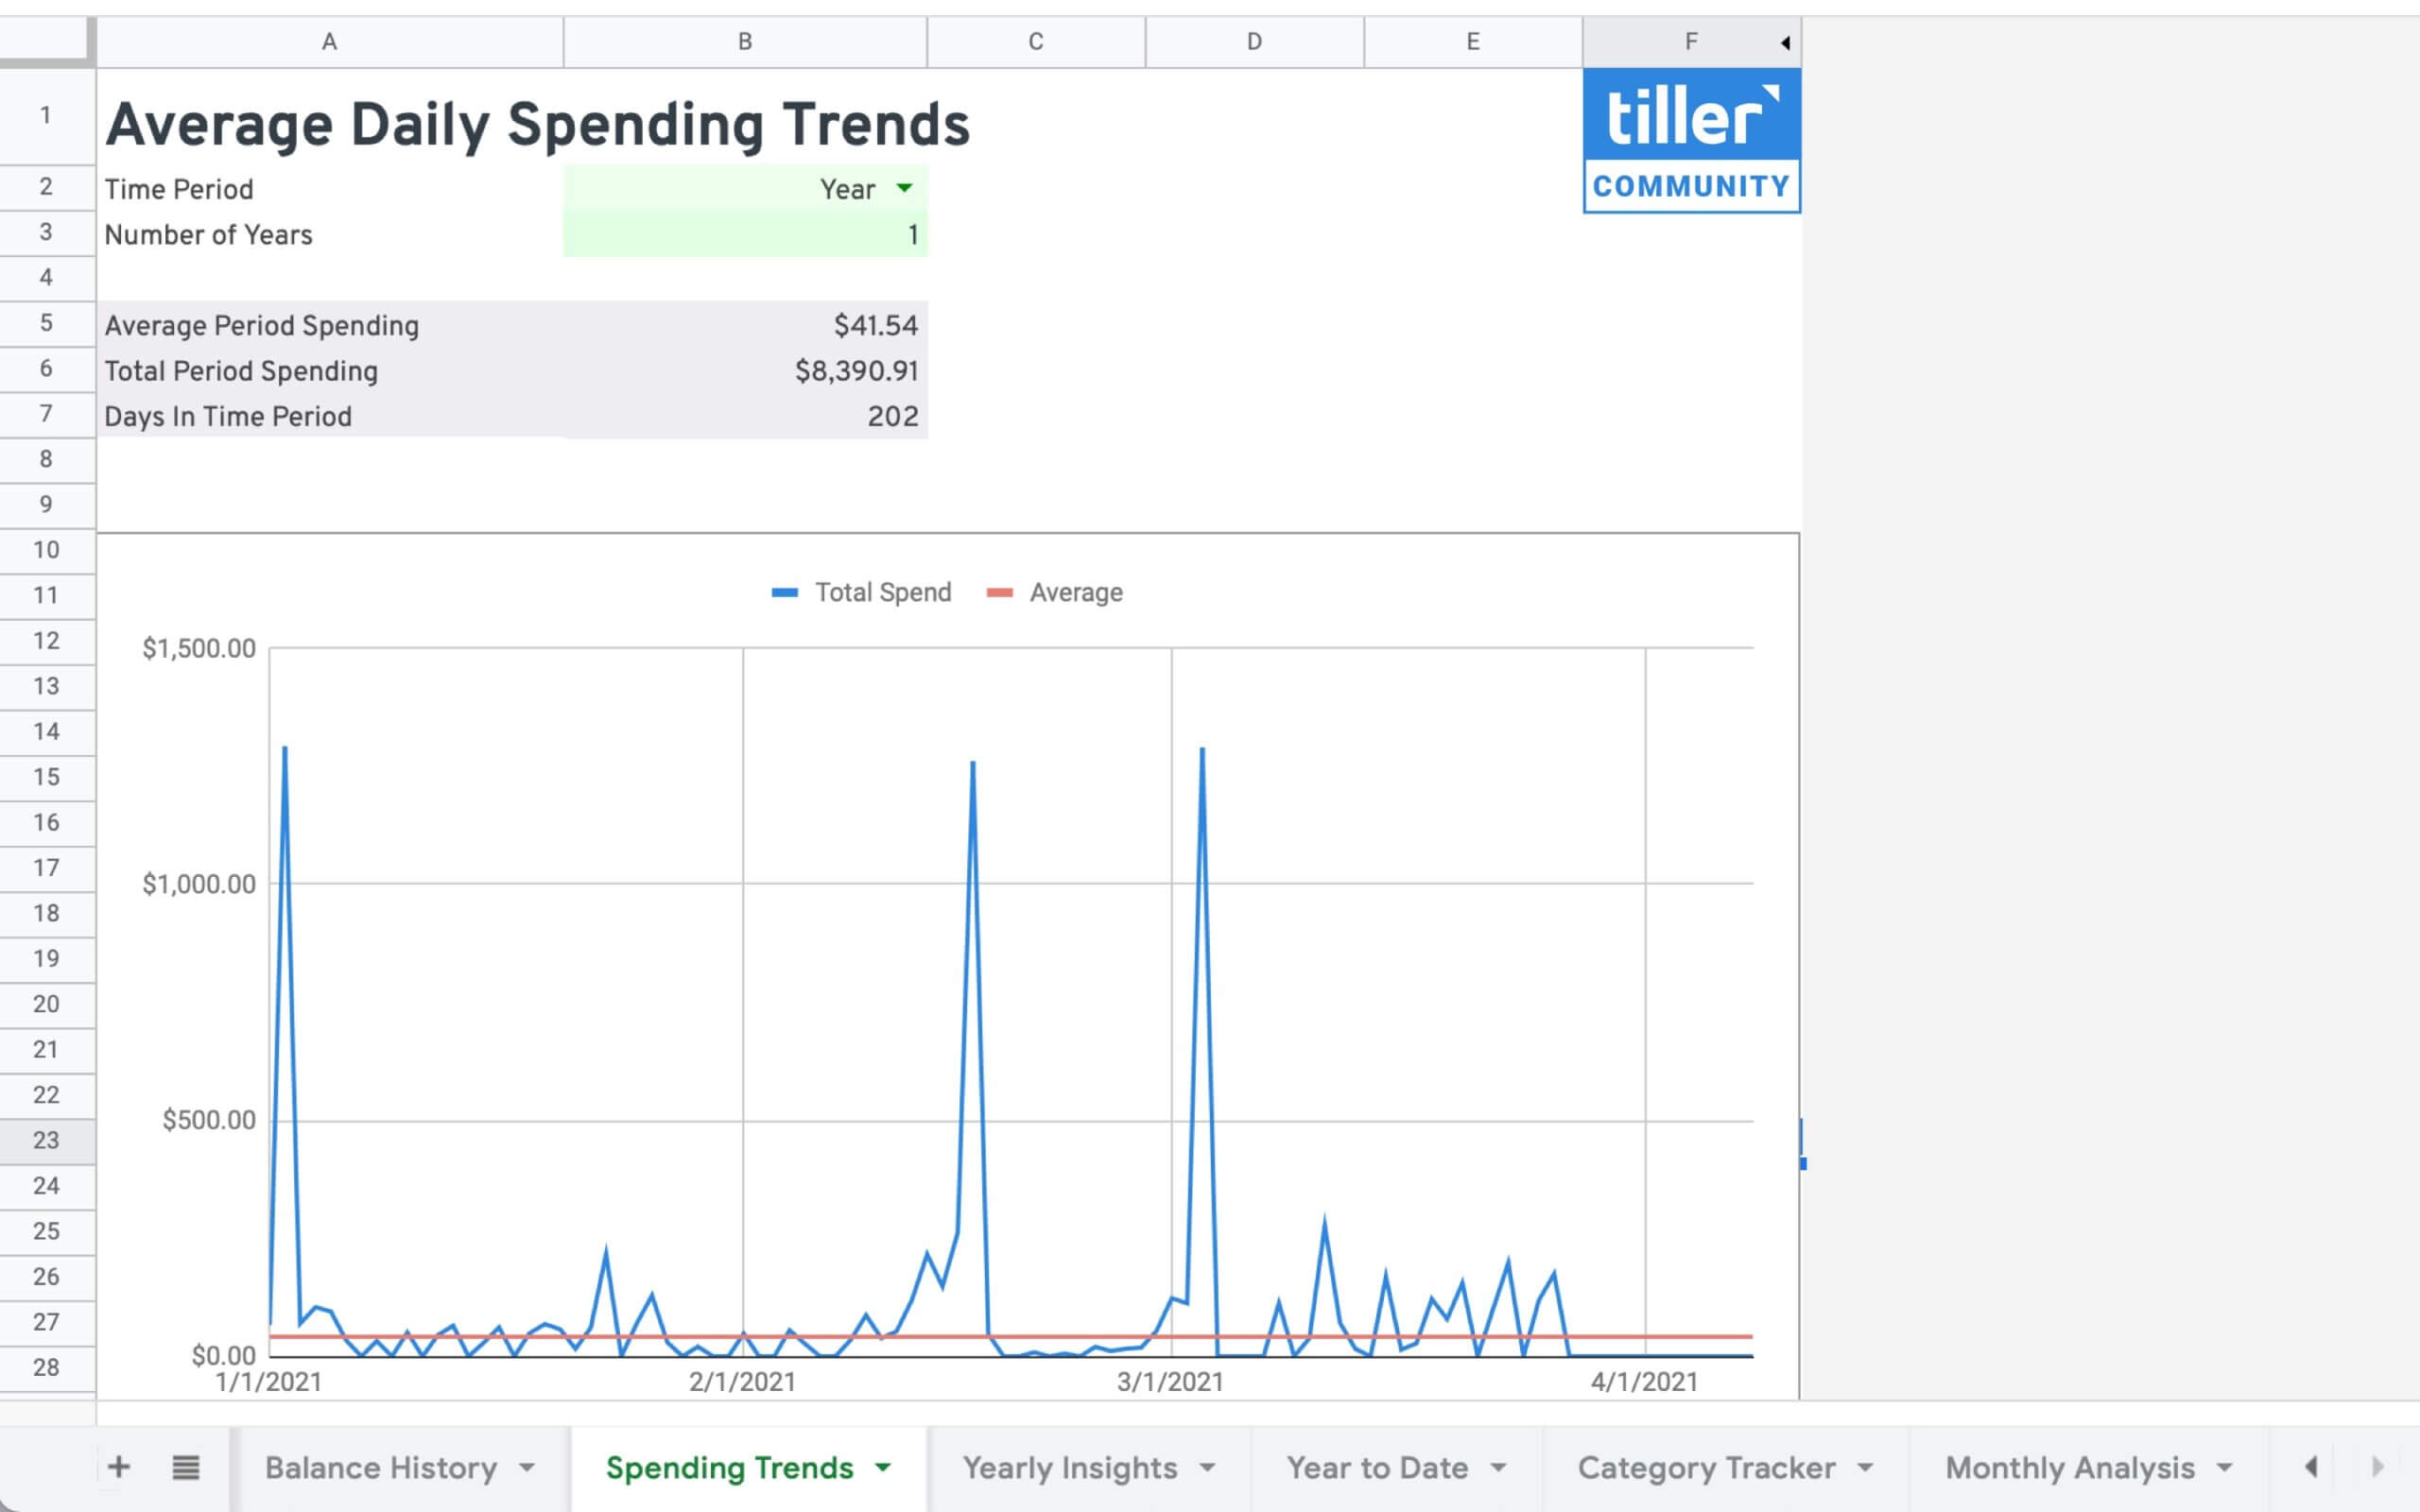
Quickly visualize your daily average spending trends in a Tiller-powered Google Sheet, so you can optimize your budget for long-term success.
How to use the Spending Trends sheet
Once you’ve added the Spending Trends sheet it should immediately begin working. There isn’t any additional configuration required, but there are some things you can do to customize the sheet.
Choosing the Time Period and Number of Periods
- You can choose to review your average daily spending across weeks (starting on Sunday or Monday), months, quarters, or years.
- You can choose how many periods you’d like to be displayed in the chart.
- Change the Time Period setting using the dropdown menu.
Support & Documentation
- View documentation for the Spending Trends sheet here the Tiller Community
- All Tiller Community Solutions are exclusively supported in the Tiller Community
This sheet has been updated to respect the Hide From Report settings in the Categories sheet.
If you update the sheet to Version 2.02, then any transactions in Hidden categories will not be counted.
The report also alerts you if you have any uncategorized transactions in the date range.